| |
Features: |
|
| |
• |
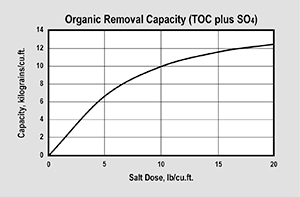
High capacity for organics |
|
| |
• |
Excellent regeneration efficiency |
|
| |
• |
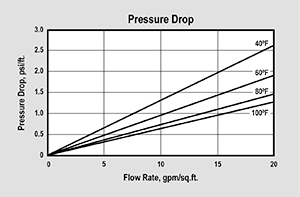
Controlled particle size, low pressure drop |
|
| |
• |
Superior physical stability |
|
| |
• |
Conforms to paragraph 21CFR173.25 of the Food Additives Regulations of the US FDA |
|
| |
• |
NSF/ANSI-61 Certified for Material Safety |
|
|
| |
| PART NUMBER |
| Sodium Form |
ER20006-HP |
|
| |
| PHYSICAL PROPERTIES |
| Polymer Structure |
Acrylic/DVB |
| Polymer Type |
Macroporous |
| Functional Group |
Quaternary Amine (Quaternary Ammonium Compound) |
| Physical Form |
Spherical beads |
| Resin Color |
White to cream |
| Ionic Form (as shipped) |
Chloride |
| Total Capacity |
> 0.8 meq/mL |
| Water Retention |
63 to 72% |
| Screen Size Distribution |
16 to 50 (US mesh) |
| Maximum Fines Content |
1% (< 50 mesh) |
| Minimum Sphericity |
93% |
| Uniformity Coefficient |
1.7 approx. |
| Approx. Ship. Wt. |
44 lb/cu.ft. |
| Packaging |
1 cu.ft. bags |
|
| |
| SUGGESTED OPERATING CONDITIONS |
| Maximum Temperature |
150°F (66°C) |
| Minimum Bed Depth |
24 inches |
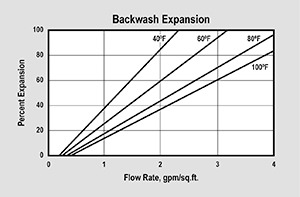
| Backwash Expansion |
25 to 50% |
| Maximum Pressure Loss |
20 psi |
| Operating pH Range |
0 to 14 (< 8.0 pH prevents fishy smell) |
Regenerant Concentration
Salt Cycle |
2 to 10% NaCl |
| Regenerant Level |
4 to 10 lb/cu.ft. |
| Regenerant Flow Rate |
0.25 to 1.0 gpm/cu.ft. |
| Regenerant Contact Time |
> 60 minutes |
| Displacement Flow Rate |
Same as dilution water |
| Displacement Volume |
10 to 15 gal/cu.ft. |
| Rinse Flow Rate |
Same as service flow |
| Rinse Volume |
35 to 60 gal/cu.ft. |
Service Flow Rate
Average Flow
Peak Flow |
1 to 4 gpm/cu.ft.
< 10 gpm/cu.ft. |
|
| |
| |
|
NOTE: Prior to first use for potable water, resin should be backwashed for a minimum of 20 minutes, followed by 10 bed volumes of downflow rinse.
|
| |
| |
|
CAUTION: DO NOT MIX ION EXCHANGE RESINS WITH STRONG OXIDIZING AGENTS. Nitric acid and other strong oxidizing agents can cause explosive reactions when mixed with organic materials such as ion exchange resins.
|
| |
ADDITIONAL INFORMATION:
SWT Ion Exchange Resin Guide
Cation Resin Selection Chart
Resin Capacity Comparison Chart
|
| |
| |
|
This information has been gathered from standard materials and or test data that is believed to be accurate and reliable. Nothing herein shall be determined to be a warranty or representation expressed or implied with respect to the use of such information or the use of the goods described for any particular purpose alone or in combination with other goods or processes, or that their use does not conflict with existing patent rights. No license is granted to practice any patented invention. It is solely for your consideration, investigation and verification.
|


